
tls-peek: HTTPS inspection for a single Windows program
Reading what one Windows program says over HTTPS.
tls-peek shows the HTTPS requests one Windows desktop program sends: URLs, headers, tokens and bodies, in a local web UI. You pick the program from a list, use it as usual, and its traffic shows up live. It's built on mitmproxy's local mode, which captures traffic through the WinDivert driver instead of a proxy setting, so it also works on programs that ignore the system proxy. That covers a lot of desktop software: Electron apps, game launchers and anything with its own HTTP stack.
It started as a small mitmproxy addon and a batch file. Five days later it was a Python app with its own UI, a tray icon, intercept, rewrite rules, TLS and timing details, passive security checks, an API map with OpenAPI export, and raw TCP, UDP and DNS views. After the first release I pointed it at more programs than the ones I had tested with, and most of what broke had nothing to do with HTTPS itself; those fixes are in this post too. The source is on GitHub, and every release has a single tlspeek.exe that needs no Python.
One program, not the whole machine
A normal intercepting proxy sees whatever is configured to use it. That's the wrong shape for this job: half the programs I wanted to look at never read the proxy setting, and the ones that do drown in browser noise. Local mode solves both. It redirects only the connections of processes you name, at the driver level, and the program doesn't know.
The program picker lists running apps with their icons, so you choose by name instead of typing .exe names. Switching is live: the addon just updates mitmproxy's options, and the next connection goes to the new target. Pause works the same way, by pointing local mode at a program name that can't exist.
ctx.options.update(
    mode=[f"local:{NO_PROGRAM if self.paused or not program else program}"],
    allow_hosts=[host_regex(host_filter)] if host_filter else [],
)
One catch shaped the whole first-run experience: WinDivert only sees new connections, so the program has to be restarted after the capture starts. The UI says so in the empty state, and it asks which program to capture as soon as a capture begins, with the last one offered first.
A certificate that doesn't outlive the capture
Decrypting HTTPS means the program has to trust a certificate authority I control, and a trusted root CA left behind on a machine is a real risk. So every capture makes a fresh CA, trusts it for that session only, and removes it again: when you press stop, when the window is closed, and at the next start in case the last one crashed. The start page shows whether a capture certificate is still trusted and has a button to remove it.
When a host refuses the certificate
Some programs pin their certificates, and some ignore the Windows certificate store entirely. In the first release both cases ended the same way: every connection to that host failed its handshake, and the program I wanted to watch stopped working while I watched it. That is the opposite of what an inspection tool should do.
Now the first refused handshake puts the host on a list, and every later connection to it is passed through without decryption. The program keeps working, its other hosts are still decrypted, and the warning bar says which hosts were skipped. The list is saved in settings.json, so in the next capture even the first connection passes through. Try again in the warning bar clears it.
def tls_clienthello(self, data):
    # a host that refused our certificate is passed through undecrypted,
    # so only its first connection ever fails
    entry = self.rejected.get(data.client_hello.sni)
    if entry:
        data.ignore_connection = True
        entry["passed"] = entry.get("passed", 0) + 1
Pass-through hides the traffic, though, and many refusals are not pinning at all. Node.js, Python, Java, Git and Firefox bring their own list of trusted CAs, so they reject a certificate Windows already trusts. For those the warning bar now shows the path of the capture certificate and the one setting each runtime needs, such as NODE_EXTRA_CA_CERTS for Node or http.sslBackend schannel for Git, along with the command to undo it where one is needed.
A UI on the standard library
The UI is plain ES modules served by Python's http.server, running in a thread next to mitmproxy's event loop. Every change to a flow bumps a counter, and the page asks for changes since the last counter it saw once a second, so a busy capture sends only the rows that changed. Anything that touches flows from the UI thread is handed to the event loop and waited on, which keeps mitmproxy's state single-threaded.
It only listens on 127.0.0.1, but a local server still needs two guards. Requests must be addressed to its own host and port, which blocks DNS rebinding, and every POST must send application/json, which forces a CORS preflight, so other sites can't post to it. HTML previews of response bodies run in a sandboxed frame with a CSP that blocks every external load.
Closing the last tab stops the capture after 10 seconds, so nothing keeps decrypting in the background after you've left. A tab that's merely asleep gets a longer grace period. The same rule ends the start page when nothing is running.
Polling has a side effect that is easy to miss: a list rebuilt every 1.5 seconds also throws away any state its buttons carried. Delete on the start page needs two clicks, and the first one marked the button as armed. The next refresh replaced the button with a fresh one, so the first click often seemed to do nothing. The armed session now lives in page state, and every redraw keeps it armed.
One bad flow, an empty list
The worst bug after the first release looked like a crash of the whole UI. The page said Disconnected and showed nothing. The cause was one DNS answer: browsers look up HTTPS records, whose answer data is a dict and not a string, and building the row text for it threw an exception. The list endpoint sent every changed flow in one response, so one bad row failed the response and the UI lost everything.
The record type got its own fix: the row shows the type, and the DNS tab prints the parameters as JSON. But the real fix is the shape of the failure. A flow the code cannot read now becomes an error row that says so, the exception goes to the console window where it can still be found, and every other flow is listed as usual. Opening that row or searching across it gets an error message back instead of a request that never answers.
try:
    return self.summary(f)
except Exception as e:
    print(f"[tls-peek] Could not read flow {f.id} ({f.type}): {e!r}")
    return {"id": self.ids[f.id], "state": "error", "info": "could not be read", ...}
A broad except is usually a smell. Here it sits at the one boundary where a single bad record should never take down the view of the others, and it logs the error rather than hiding it.
Changing traffic on purpose
Intercept holds requests or responses that match a URL and method, so you can edit them before the program or the server sees them. It's the most direct tool and also the most disruptive one: the program waits while something is held, and some give up after a timeout. For repeatable changes there are rewrite rules: set or remove a header, find and replace in the URL or body, or answer with a fixed response without contacting the server. "New rule" on any request starts one from its host, path and method, with the captured response already filled in, so mocking a call is one edit.
Sending your own requests
Edit and resend was the first way to send something yourself, but it always started from a captured request. Version 1.2.2 adds a request composer. You can write a request from scratch, or paste a cURL command copied from a browser's dev tools and have the method, URL, headers and body filled in. Duplicate sends a captured request again unchanged. A request sent this way remembers which request it came from, so Compare with original shows the two side by side, response included.
Pasted commands come in two dialects. Browsers on Windows offer cURL in bash form and in cmd form, and the cmd form escapes quotes, braces and line ends with ^. Bodies with special characters come in bash's $'...' quoting with C escapes. The parser handles both forms and is the one part of the UI with its own Node test, which CI runs on every push.
Requests worth keeping can be saved to captures\saved-requests.json and sent again later, as they are or after an edit. They keep their tokens and cookies as written, in plain text, like the session files next to them. The Copy menu also gained fetch, HTTPie and the raw request text.
More than headers
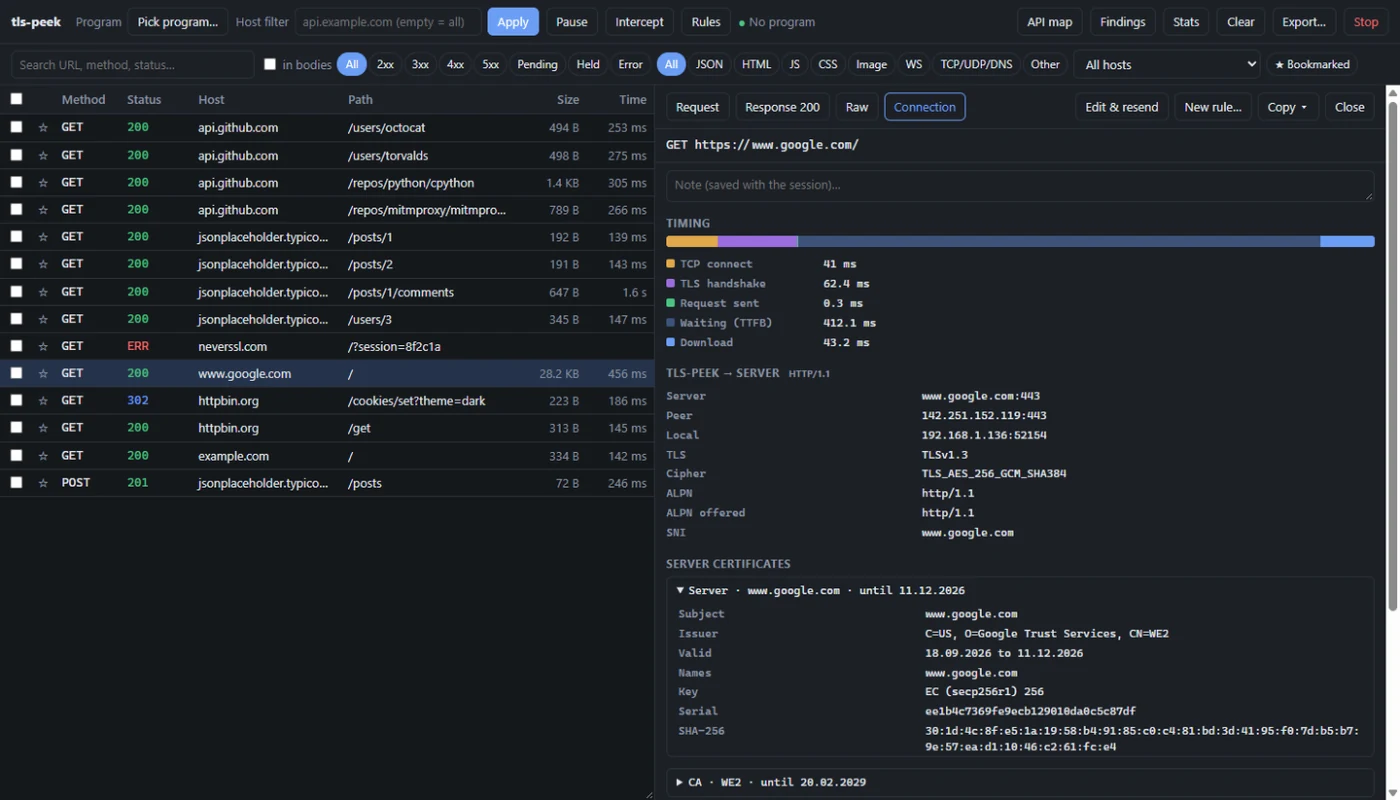
Once requests were visible, the interesting questions were about everything around them. The Connection tab shows both TLS sides (program to tls-peek, tls-peek to the server) with version, cipher, ALPN and SNI, the server's real certificate chain, and the request's time split into connect, TLS, send, waiting and download. The waterfall draws the same phases, and a reused connection shows no connect or TLS time, which makes connection pooling easy to spot.
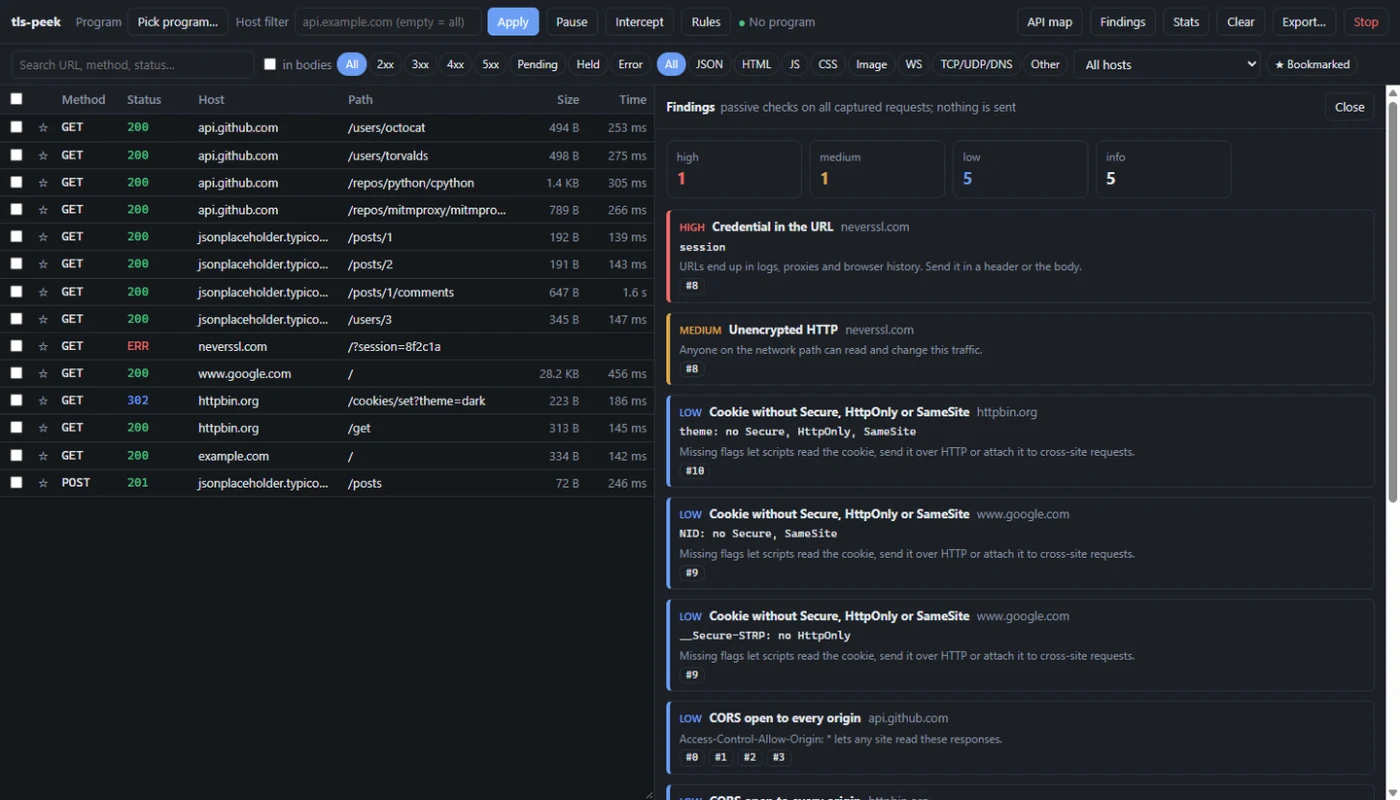
The findings panel runs 13 checks over the captured traffic without sending anything: credentials in URLs, plain HTTP, Basic auth, JWTs with alg: none, no expiry or still accepted after expiring, CORS that allows credentials from any origin, missing cookie flags, old TLS versions, expired certificates, missing HSTS and version numbers in server headers. An early version of the cookie check searched the raw header text for "secure", so a cookie named __Secure-id counted as having the flag. It now parses the attributes, and a test covers that case.
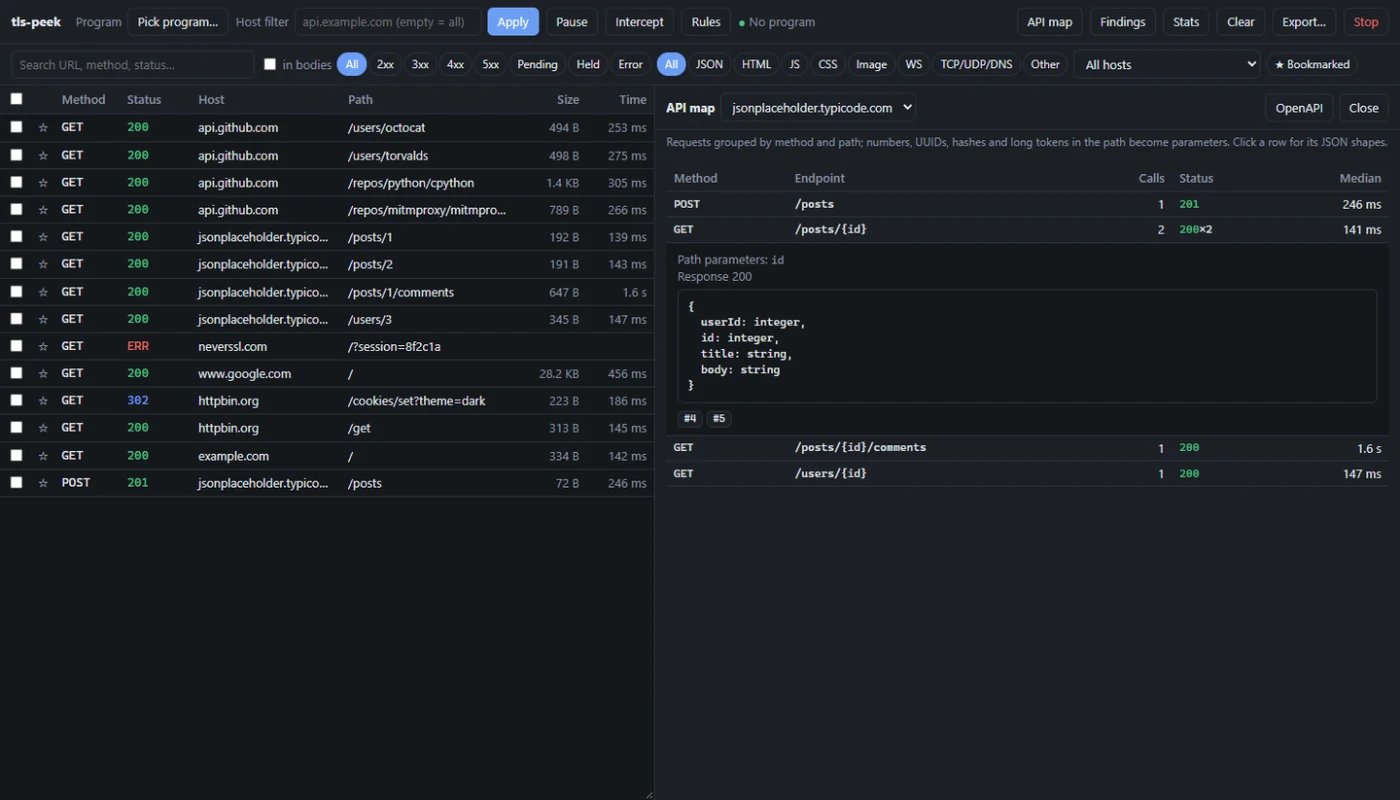
The API map groups requests into endpoints. Numbers, UUIDs, hashes and long tokens in a path become parameters, so /posts/1 and /posts/2 are one endpoint. Names are harder: /users/octocat looks like any other path segment. The trick is to compare the answers. Paths with the same shape whose JSON responses have the same keys merge into /users/{name}, and /users/settings, which answers differently, stays separate. Each endpoint shows its calls, statuses, median time and a type sketch of its request and response bodies, and a host's endpoints download as an OpenAPI 3 skeleton.
Local mode also captures traffic that isn't HTTP, which the first versions dropped. TCP and UDP streams now show each message as text and hex, DNS lookups show their question, answers and flags, and every HTTP request has a Raw tab with the message as it looks on the wire and its header and body byte counts.
Live streams that hold still
An open TCP or UDP flow changes every second. Each change refetched the flow and rebuilt the whole detail panel, with up to 1,000 messages and a hex dump for each: about 19 MB and more than a second of work, every second. The panel froze, and clicks on it got lost.
The first fix cut the work: the detail refreshes only while the Messages tab is open, it does not rebuild while a click is in progress, and it shows the last 200 messages with hex dumps capped at 1 KB. The second fix changed the idea. A live stream only ever gains messages at the end and loses old ones at the start, so redrawing it is the wrong operation. New messages are now appended and the oldest removed, and everything already on screen stays as it is: opened hex dumps, selected text and the scroll position.
The Connection tab had a quieter bug on the same flows. TCP, UDP and DNS flows sent no timing data, so the tab threw before it drew anything and a click on it seemed to do nothing. They now get connect and TLS times with empty HTTP phases.
Sharing without leaking
Captures are full of credentials, so exports mask them by default. Field names are split into words (X-Api-Key becomes x, api, key; accessToken becomes access, token), and a field is masked when one of its words is on a list. That catches most things, but a token in a field called data slips through, so JWTs and bearer tokens are also masked by value, wherever they appear. HAR and Postman exports both go through the same masking, and every stopped capture leaves a masked HAR next to the session file.
Testing a tool that needs admin
Local mode needs administrator rights, which a CI runner doesn't have. So the tests start mitmproxy in regular proxy mode with the same addon, point real HTTP calls at it, and drive the UI's API: a held request makes the caller wait, gets edited and continues; a rule rewrites a body; stop and auto-stop end the process; a capture dies with the process that started it. The parts that don't need a server (masking, findings, endpoint grouping) are checked directly. A GitHub Actions job runs all of it on Windows on every push and builds the exe, and a version tag publishes it as a release.
CI also caught a real bug on its first day. A request counted as done as soon as its response headers arrived, while the body was still loading, and a test read it in that gap on a slower runner. It now stays pending until the response ends.
The bugs real traffic found had all passed the test suite, because the fixtures were the simplest flow of each kind. The new test builds one session of varied flows (an errored request, a streamed body, WebSocket, an empty TCP flow, an HTTPS DNS record) and sends every one of them through every view: the list, the detail, the raw view, findings, the API map, search and both exports.
CI got one more step for a different kind of mistake. A broken string in main.js once stopped the whole page from loading while every Python test passed, because no test loads the page. Each UI module is now parsed with Node before the tests run, which takes a second and catches that whole class of error.
- name: UI scripts parse
  run: for f in ui/*.js; do node --input-type=module --check < "$f" || exit 1; done
Releases you can check
The first release did not say which version it was. CI now writes the git tag into app/version.py before it builds the exe, so the start page and tlspeek --version name the release, and runs from source say dev. The first attempt appended a second version line instead of replacing the placeholder, which worked by accident; it now rewrites the line.
Every release also carries a tlspeek.exe.sha256 file, and the README gives the certutil command to compare it. An exe that installs a root CA and asks for admin rights should be easy to verify before anyone runs it.
The exe also moved its data. Settings, captures and the capture CA now live in %LOCALAPPDATA%\tls-peek instead of next to the exe, so they survive moving the file and never end up in a folder that syncs to the cloud. Runs from source still use the repository folder, and the start page has an Open folder button.
Limits
Pass-through keeps a program working, but its traffic to that host is not decrypted, so pinned hosts are invisible apart from their names. The certificate settings for Node.js, Python, Java, Git and Firefox are shown, not applied, and the Python ones replace the bundled CA list, so other hosts fail until they are unset. Local mode needs admin and only sees connections opened after the capture starts. Bodies over 5 MB are streamed through and not stored, and the UI keeps the last 5,000 requests while the session file keeps everything. WebSocket, TCP, UDP and DNS flows can be read but not edited or resent. Masking works on names and token shapes, so other personal data in free text isn't masked, and exports are worth a look before they leave the machine. The UI is tested through its API and a syntax check, not in a browser.